> ## Documentation Index
> Fetch the complete documentation index at: https://docs.cassidyai.com/llms.txt
> Use this file to discover all available pages before exploring further.
# Analyze data in Workflows
> Use Code Execution & File Creation on a Generate Text action to analyze files, generate charts, and create reports.
The **Code Execution & File Creation** setting enables [Workflow](/workflows/overview) actions to automatically analyze, manipulate, and generate insights from structured data files like CSVs, Excel spreadsheets, PowerPoint presentations, Word documents, and PDFs. When enabled, the AI writes code on-the-fly to perform complex data operations, create visualizations, and make direct edits to files — all without requiring technical expertise.
This is particularly useful for tasks like:
* Analyzing sales data exports to uncover trends
* Generating formatted monthly reports with charts and graphs
* Editing custom presentation templates with AI-generated content
* Transforming raw data into polished, branded deliverables
## Enable Code Execution & File Creation
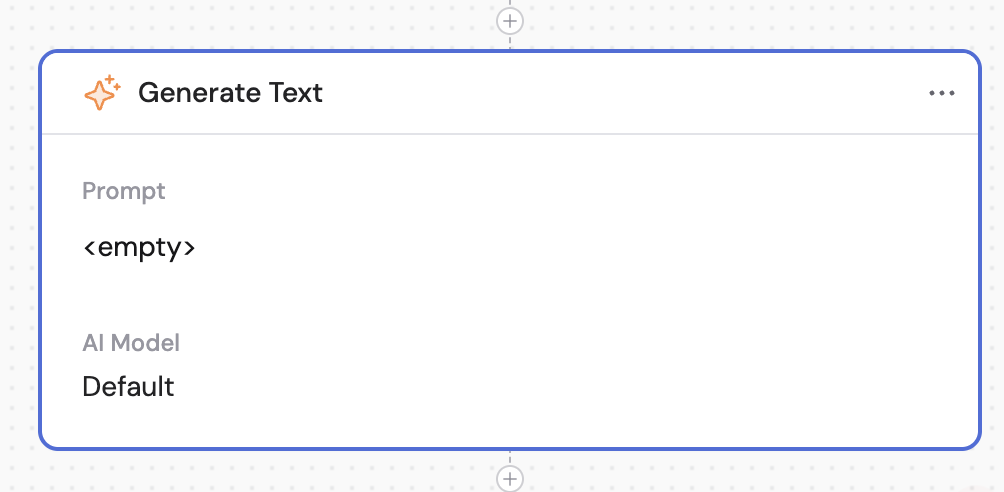
In your [Workflow editor](/workflows/building), click the **+** button to add a new action and select **Generate Text**.
 In the action's settings panel, expand **Code Execution & File Creation** and turn on the setting.
Screenshot needed: Generate Text action settings with Code Execution & File Creation enabled.
This allows the action to process file attachments and generate insights by writing and executing code behind the scenes.
## Use an Agent with Code Execution & File Creation
The [Generate Text with Agent](/reference/actions/generate-text-with-agent) action inherits its capabilities and advanced settings from the selected [Agent](/agents/overview). New custom Agents have **Code Execution & File Creation** enabled by default. If data analysis or file generation is missing, edit the Agent and enable **Code Execution & File Creation** under **Customize** > **Advanced Settings**.
## Example: Sales data analysis to report
This walkthrough demonstrates a complete data analysis use case — uploading a sales data spreadsheet, analyzing it to create insights and visualizations, and combining results into a PowerPoint presentation.
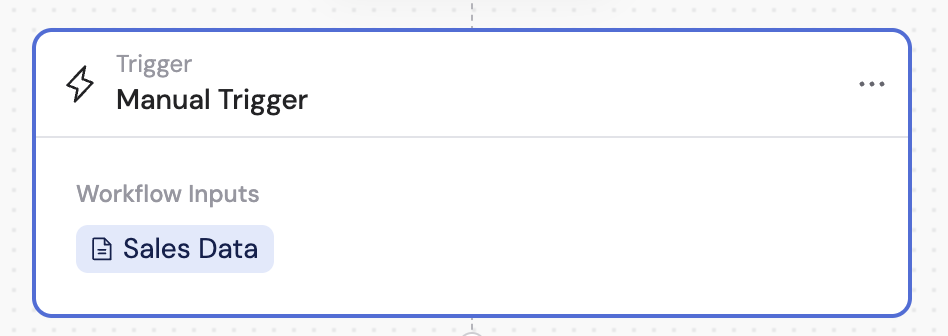
Create a Workflow with a [Manual trigger](/reference/triggers/manual) that accepts file uploads. Add a file input field so users can upload Excel or CSV files containing sales data.
In the action's settings panel, expand **Code Execution & File Creation** and turn on the setting.
Screenshot needed: Generate Text action settings with Code Execution & File Creation enabled.
This allows the action to process file attachments and generate insights by writing and executing code behind the scenes.
## Use an Agent with Code Execution & File Creation
The [Generate Text with Agent](/reference/actions/generate-text-with-agent) action inherits its capabilities and advanced settings from the selected [Agent](/agents/overview). New custom Agents have **Code Execution & File Creation** enabled by default. If data analysis or file generation is missing, edit the Agent and enable **Code Execution & File Creation** under **Customize** > **Advanced Settings**.
## Example: Sales data analysis to report
This walkthrough demonstrates a complete data analysis use case — uploading a sales data spreadsheet, analyzing it to create insights and visualizations, and combining results into a PowerPoint presentation.
Create a Workflow with a [Manual trigger](/reference/triggers/manual) that accepts file uploads. Add a file input field so users can upload Excel or CSV files containing sales data.
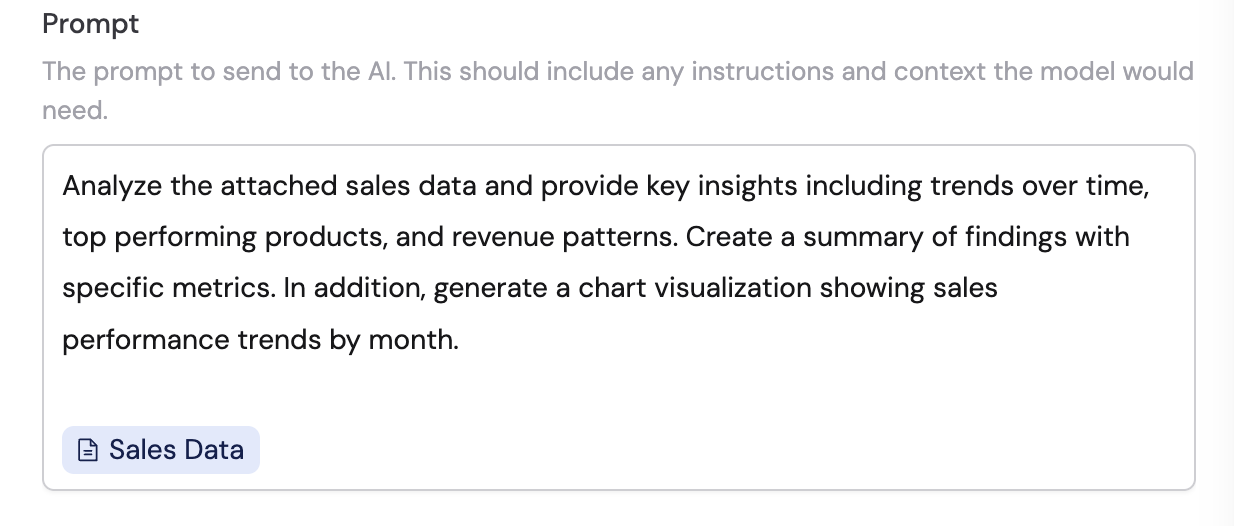
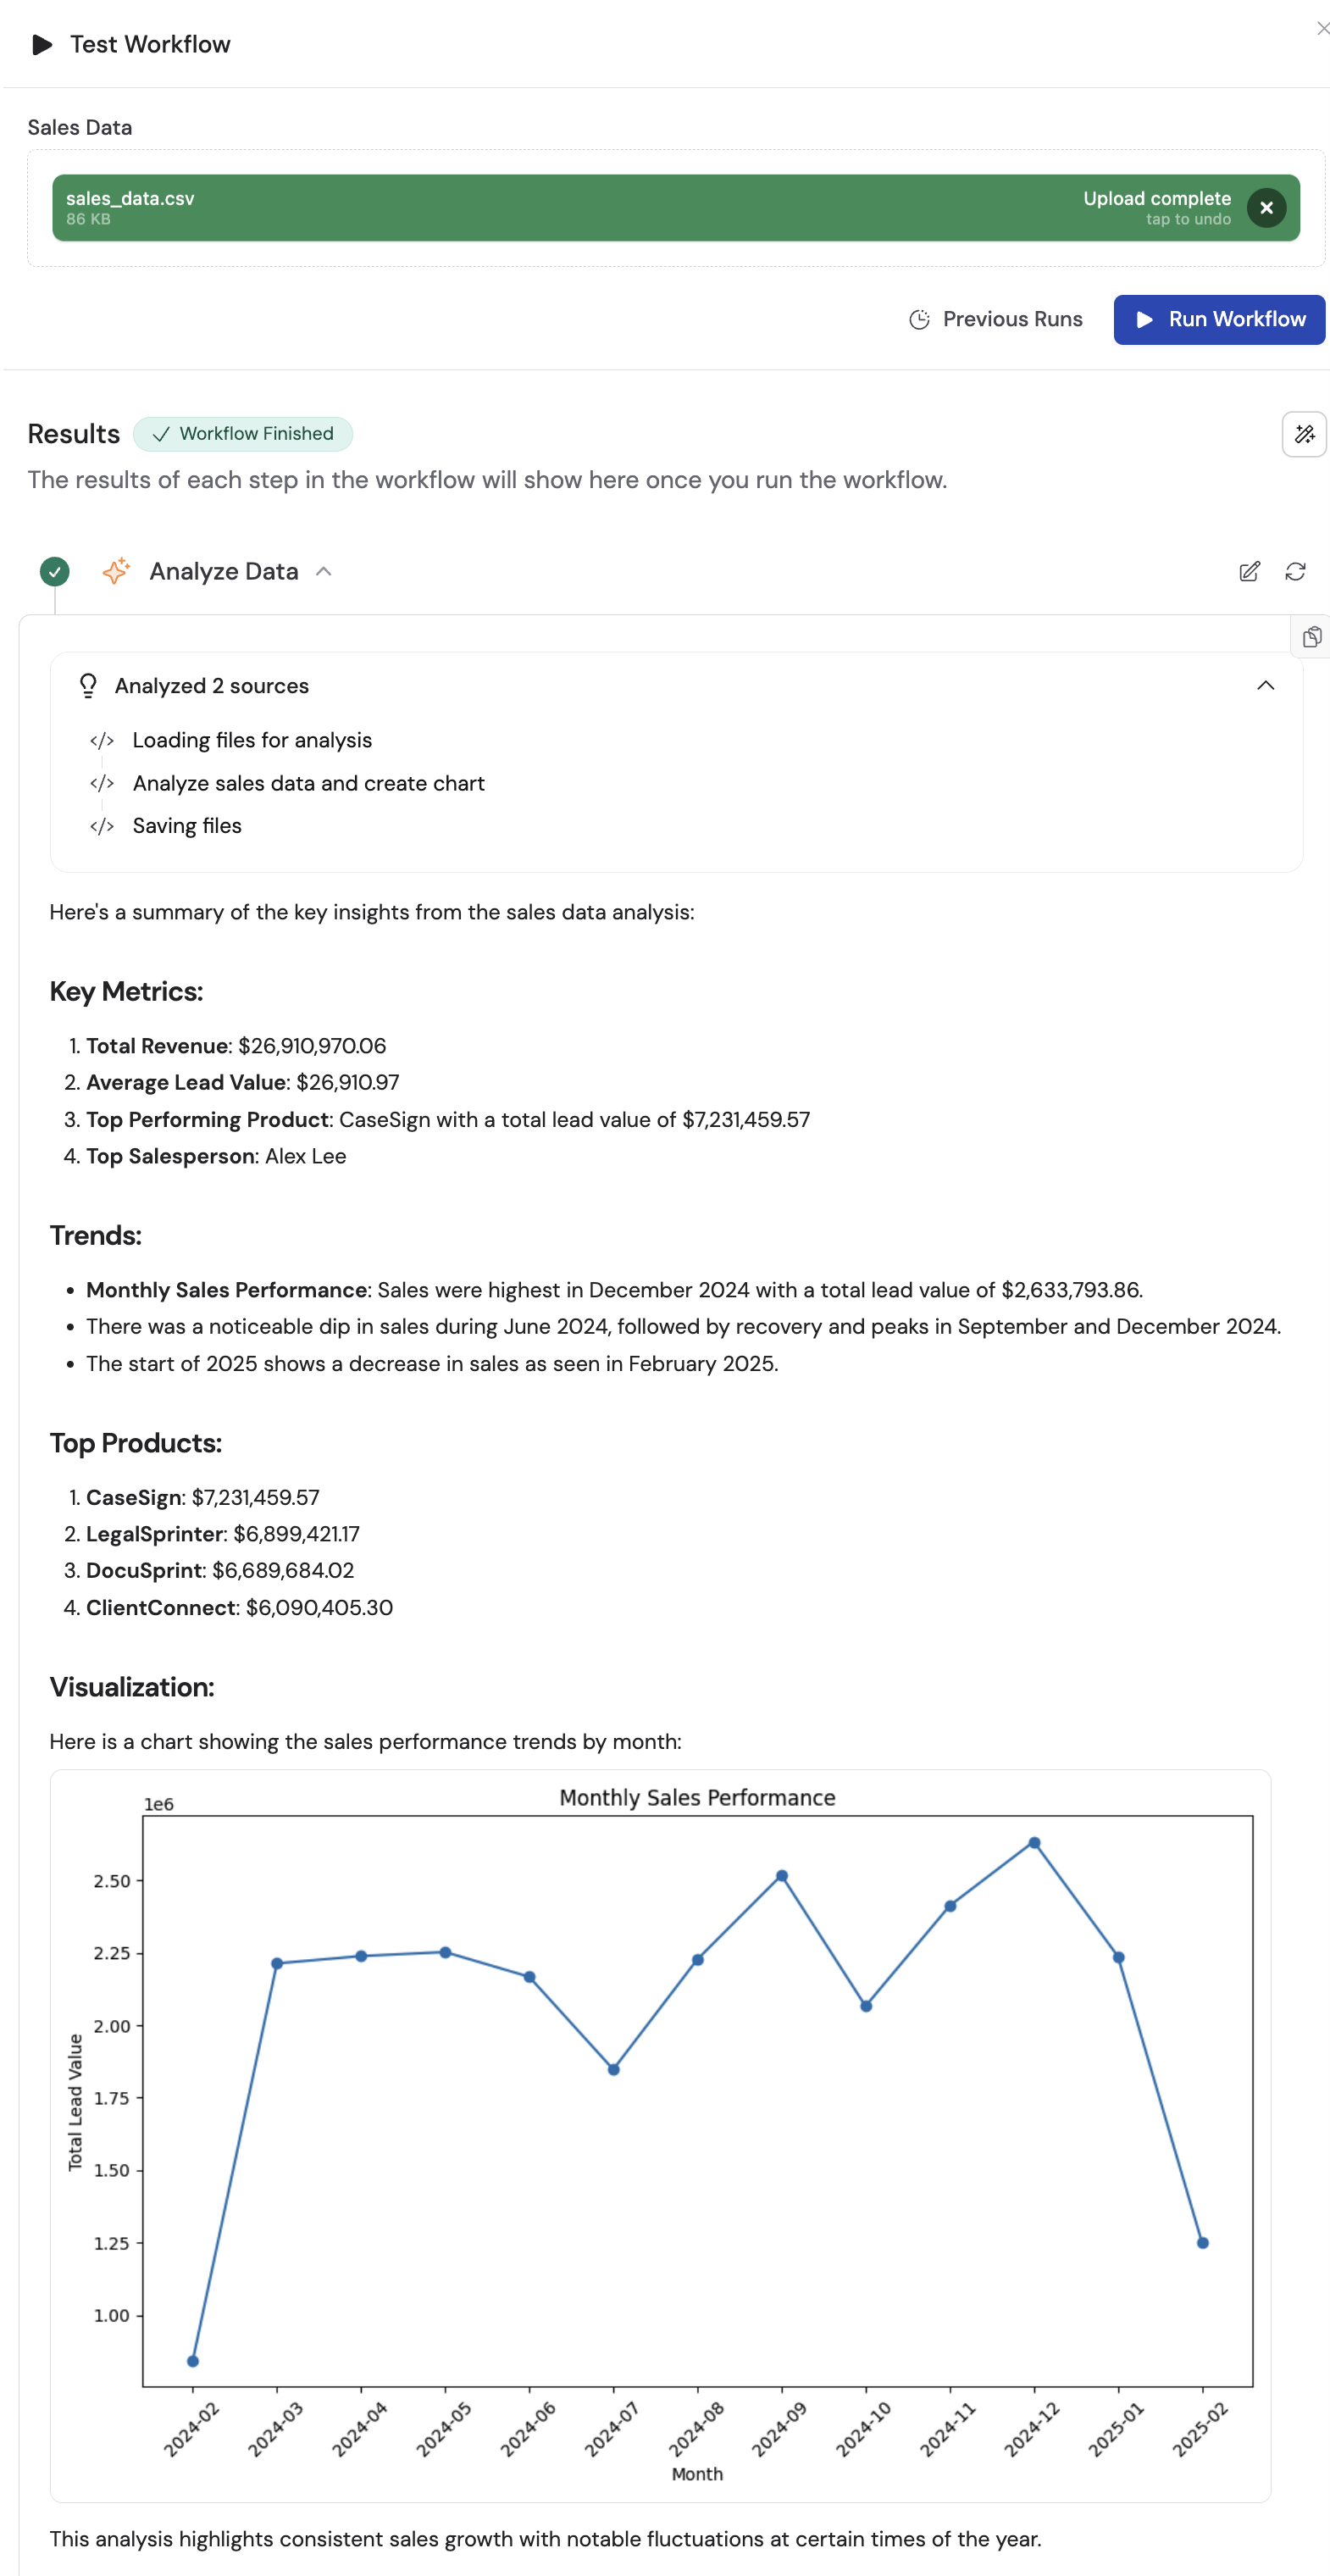
 Add a **Generate Text** action and reference the uploaded file from your trigger in the prompt. For example:
*"Analyze the attached sales data and provide key insights including trends over time, top performing products, and revenue patterns. Create a summary of findings with specific metrics. In addition, generate a chart visualization showing sales performance trends by month."*
Add a **Generate Text** action and reference the uploaded file from your trigger in the prompt. For example:
*"Analyze the attached sales data and provide key insights including trends over time, top performing products, and revenue patterns. Create a summary of findings with specific metrics. In addition, generate a chart visualization showing sales performance trends by month."*
 You can reference files from trigger attachments or data outputs from previous Workflow steps, allowing you to chain multiple data processing actions together.
Expand **Code Execution & File Creation** and turn on the setting.
Screenshot needed: Generate Text action settings with Code Execution & File Creation enabled.
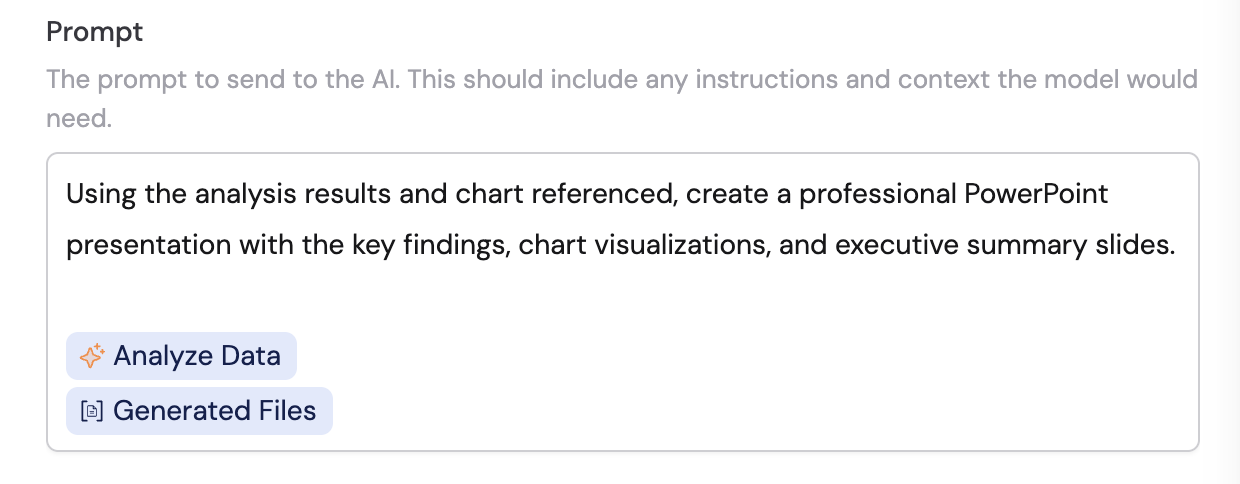
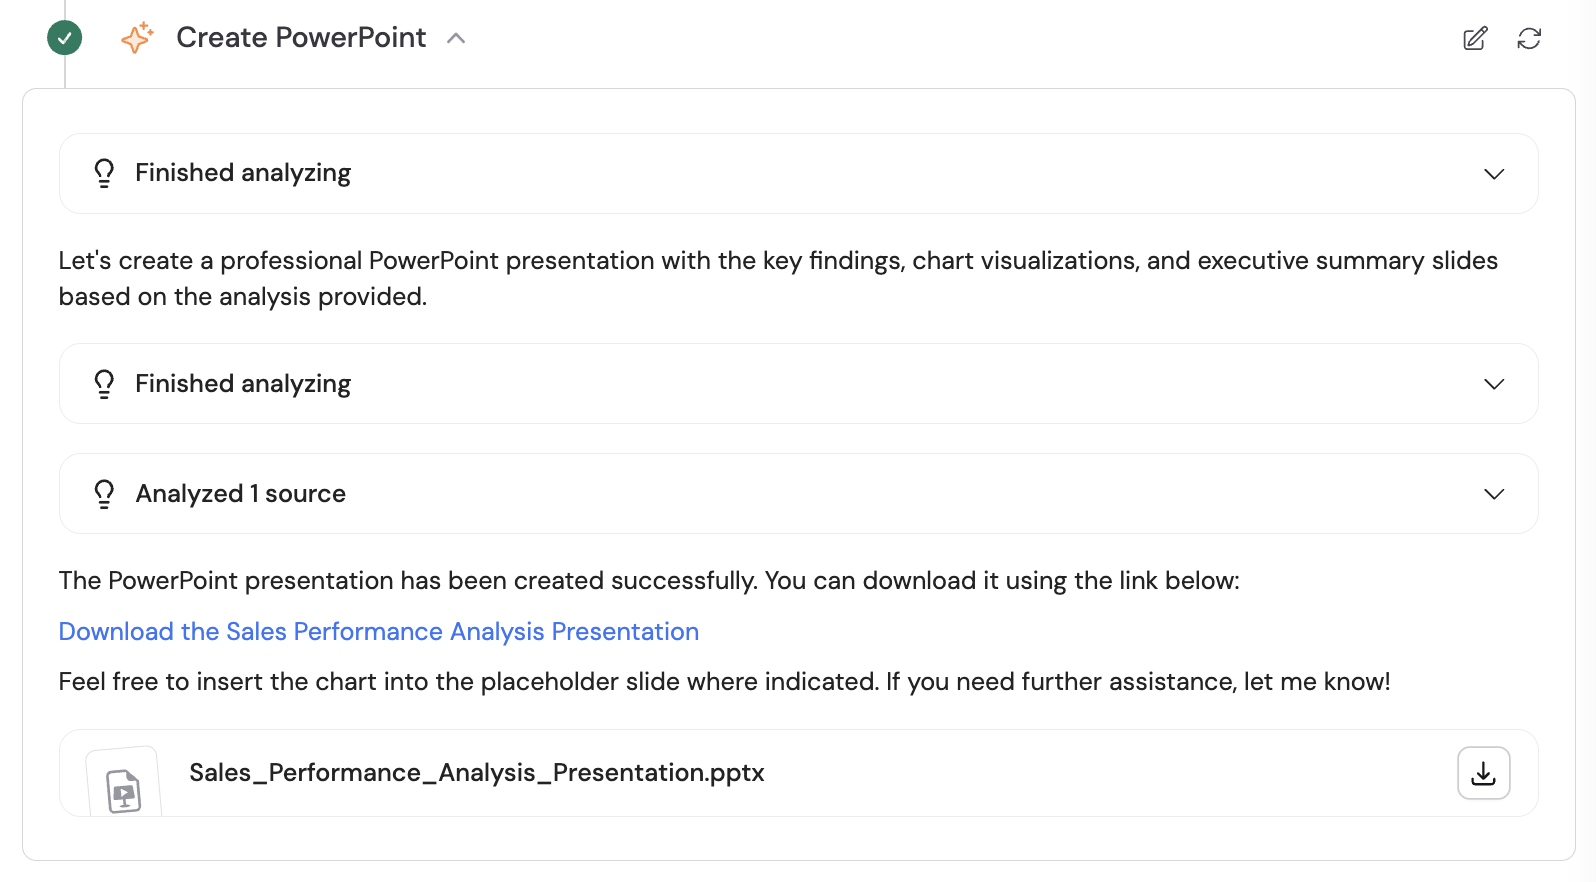
Add another **Generate Text** action to create a PowerPoint presentation from the analysis. Reference the output from the first step and prompt it to build a report:
*"Using the analysis results and chart referenced, create a professional PowerPoint presentation with the key findings, chart visualizations, and executive summary slides."*
You can reference files from trigger attachments or data outputs from previous Workflow steps, allowing you to chain multiple data processing actions together.
Expand **Code Execution & File Creation** and turn on the setting.
Screenshot needed: Generate Text action settings with Code Execution & File Creation enabled.
Add another **Generate Text** action to create a PowerPoint presentation from the analysis. Reference the output from the first step and prompt it to build a report:
*"Using the analysis results and chart referenced, create a professional PowerPoint presentation with the key findings, chart visualizations, and executive summary slides."*
 Enable **Code Execution & File Creation** on this action as well so the AI can create and format the presentation.
When Code Execution & File Creation is enabled on an action, a **Generated Files** variable appears in the outputs. Reference this variable when passing files between steps.
Execute the Workflow by uploading a sales data file. The first step analyzes the data and generates charts, then the second step uses those results to produce a PowerPoint presentation.
## Review results and download files
When a Workflow with Code Execution & File Creation completes, you can inspect exactly what happened and download any generated files.
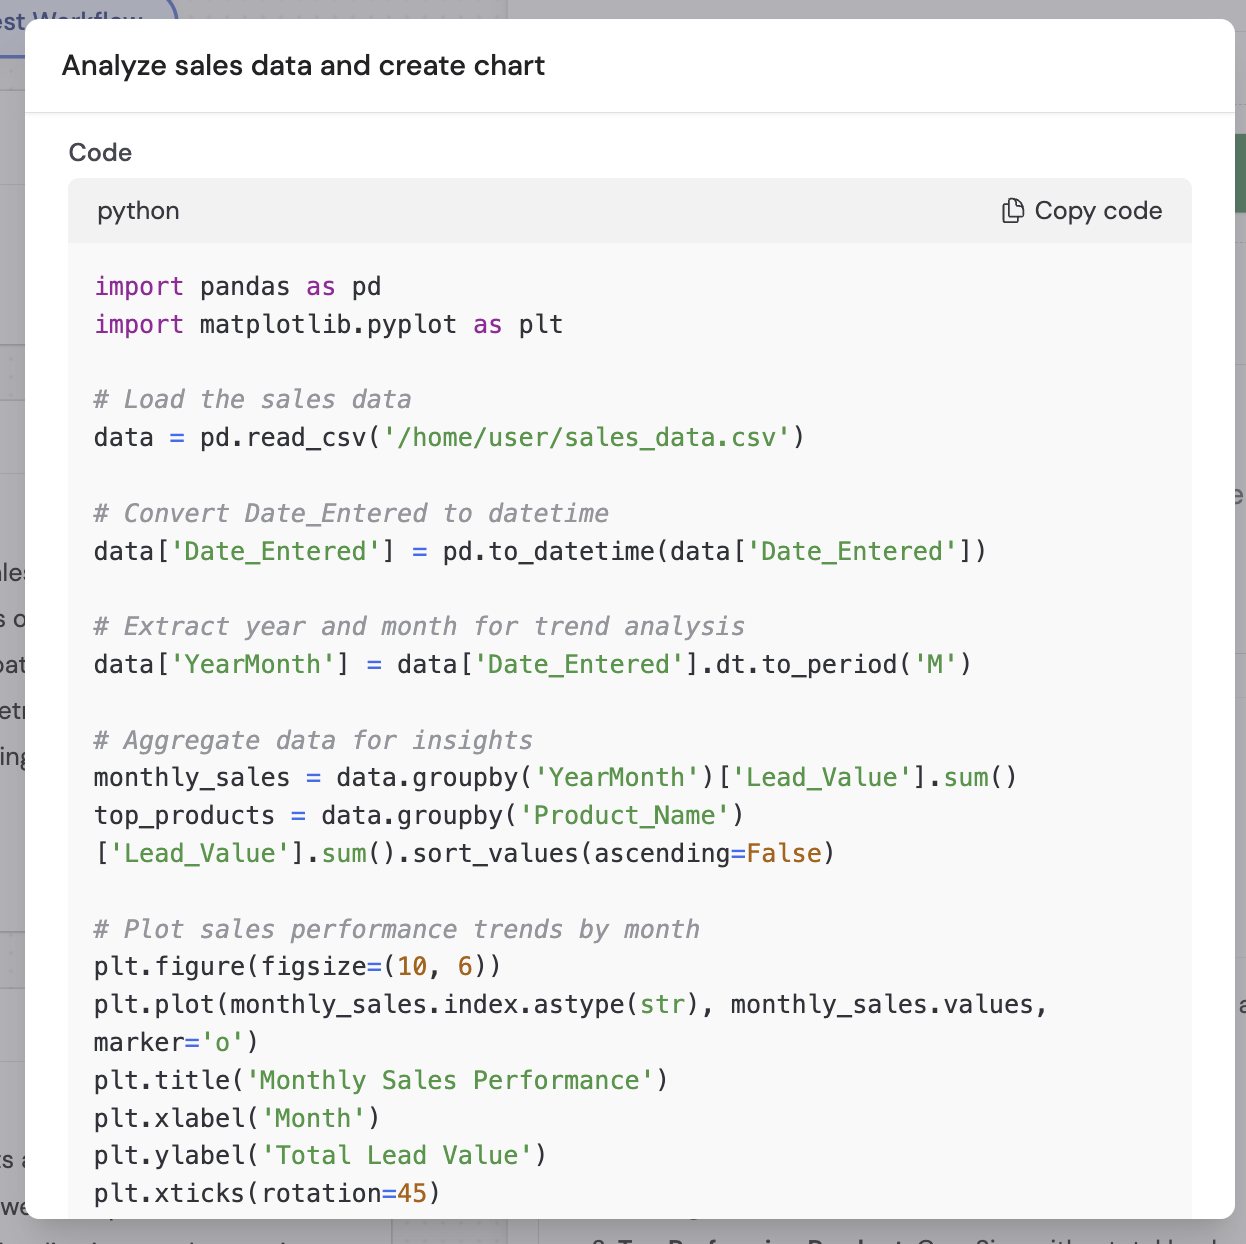
### View the analysis code
Click **Analyzed sources** in the results panel, then click the code icon (``) next to any analysis step to open a modal showing the Python code the AI wrote to process your data.
Enable **Code Execution & File Creation** on this action as well so the AI can create and format the presentation.
When Code Execution & File Creation is enabled on an action, a **Generated Files** variable appears in the outputs. Reference this variable when passing files between steps.
Execute the Workflow by uploading a sales data file. The first step analyzes the data and generates charts, then the second step uses those results to produce a PowerPoint presentation.
## Review results and download files
When a Workflow with Code Execution & File Creation completes, you can inspect exactly what happened and download any generated files.
### View the analysis code
Click **Analyzed sources** in the results panel, then click the code icon (``) next to any analysis step to open a modal showing the Python code the AI wrote to process your data.
 ### Download generated files
Any files created during the analysis — charts, presentations, reports — appear with download buttons in the results panel.
### Download generated files
Any files created during the analysis — charts, presentations, reports — appear with download buttons in the results panel.
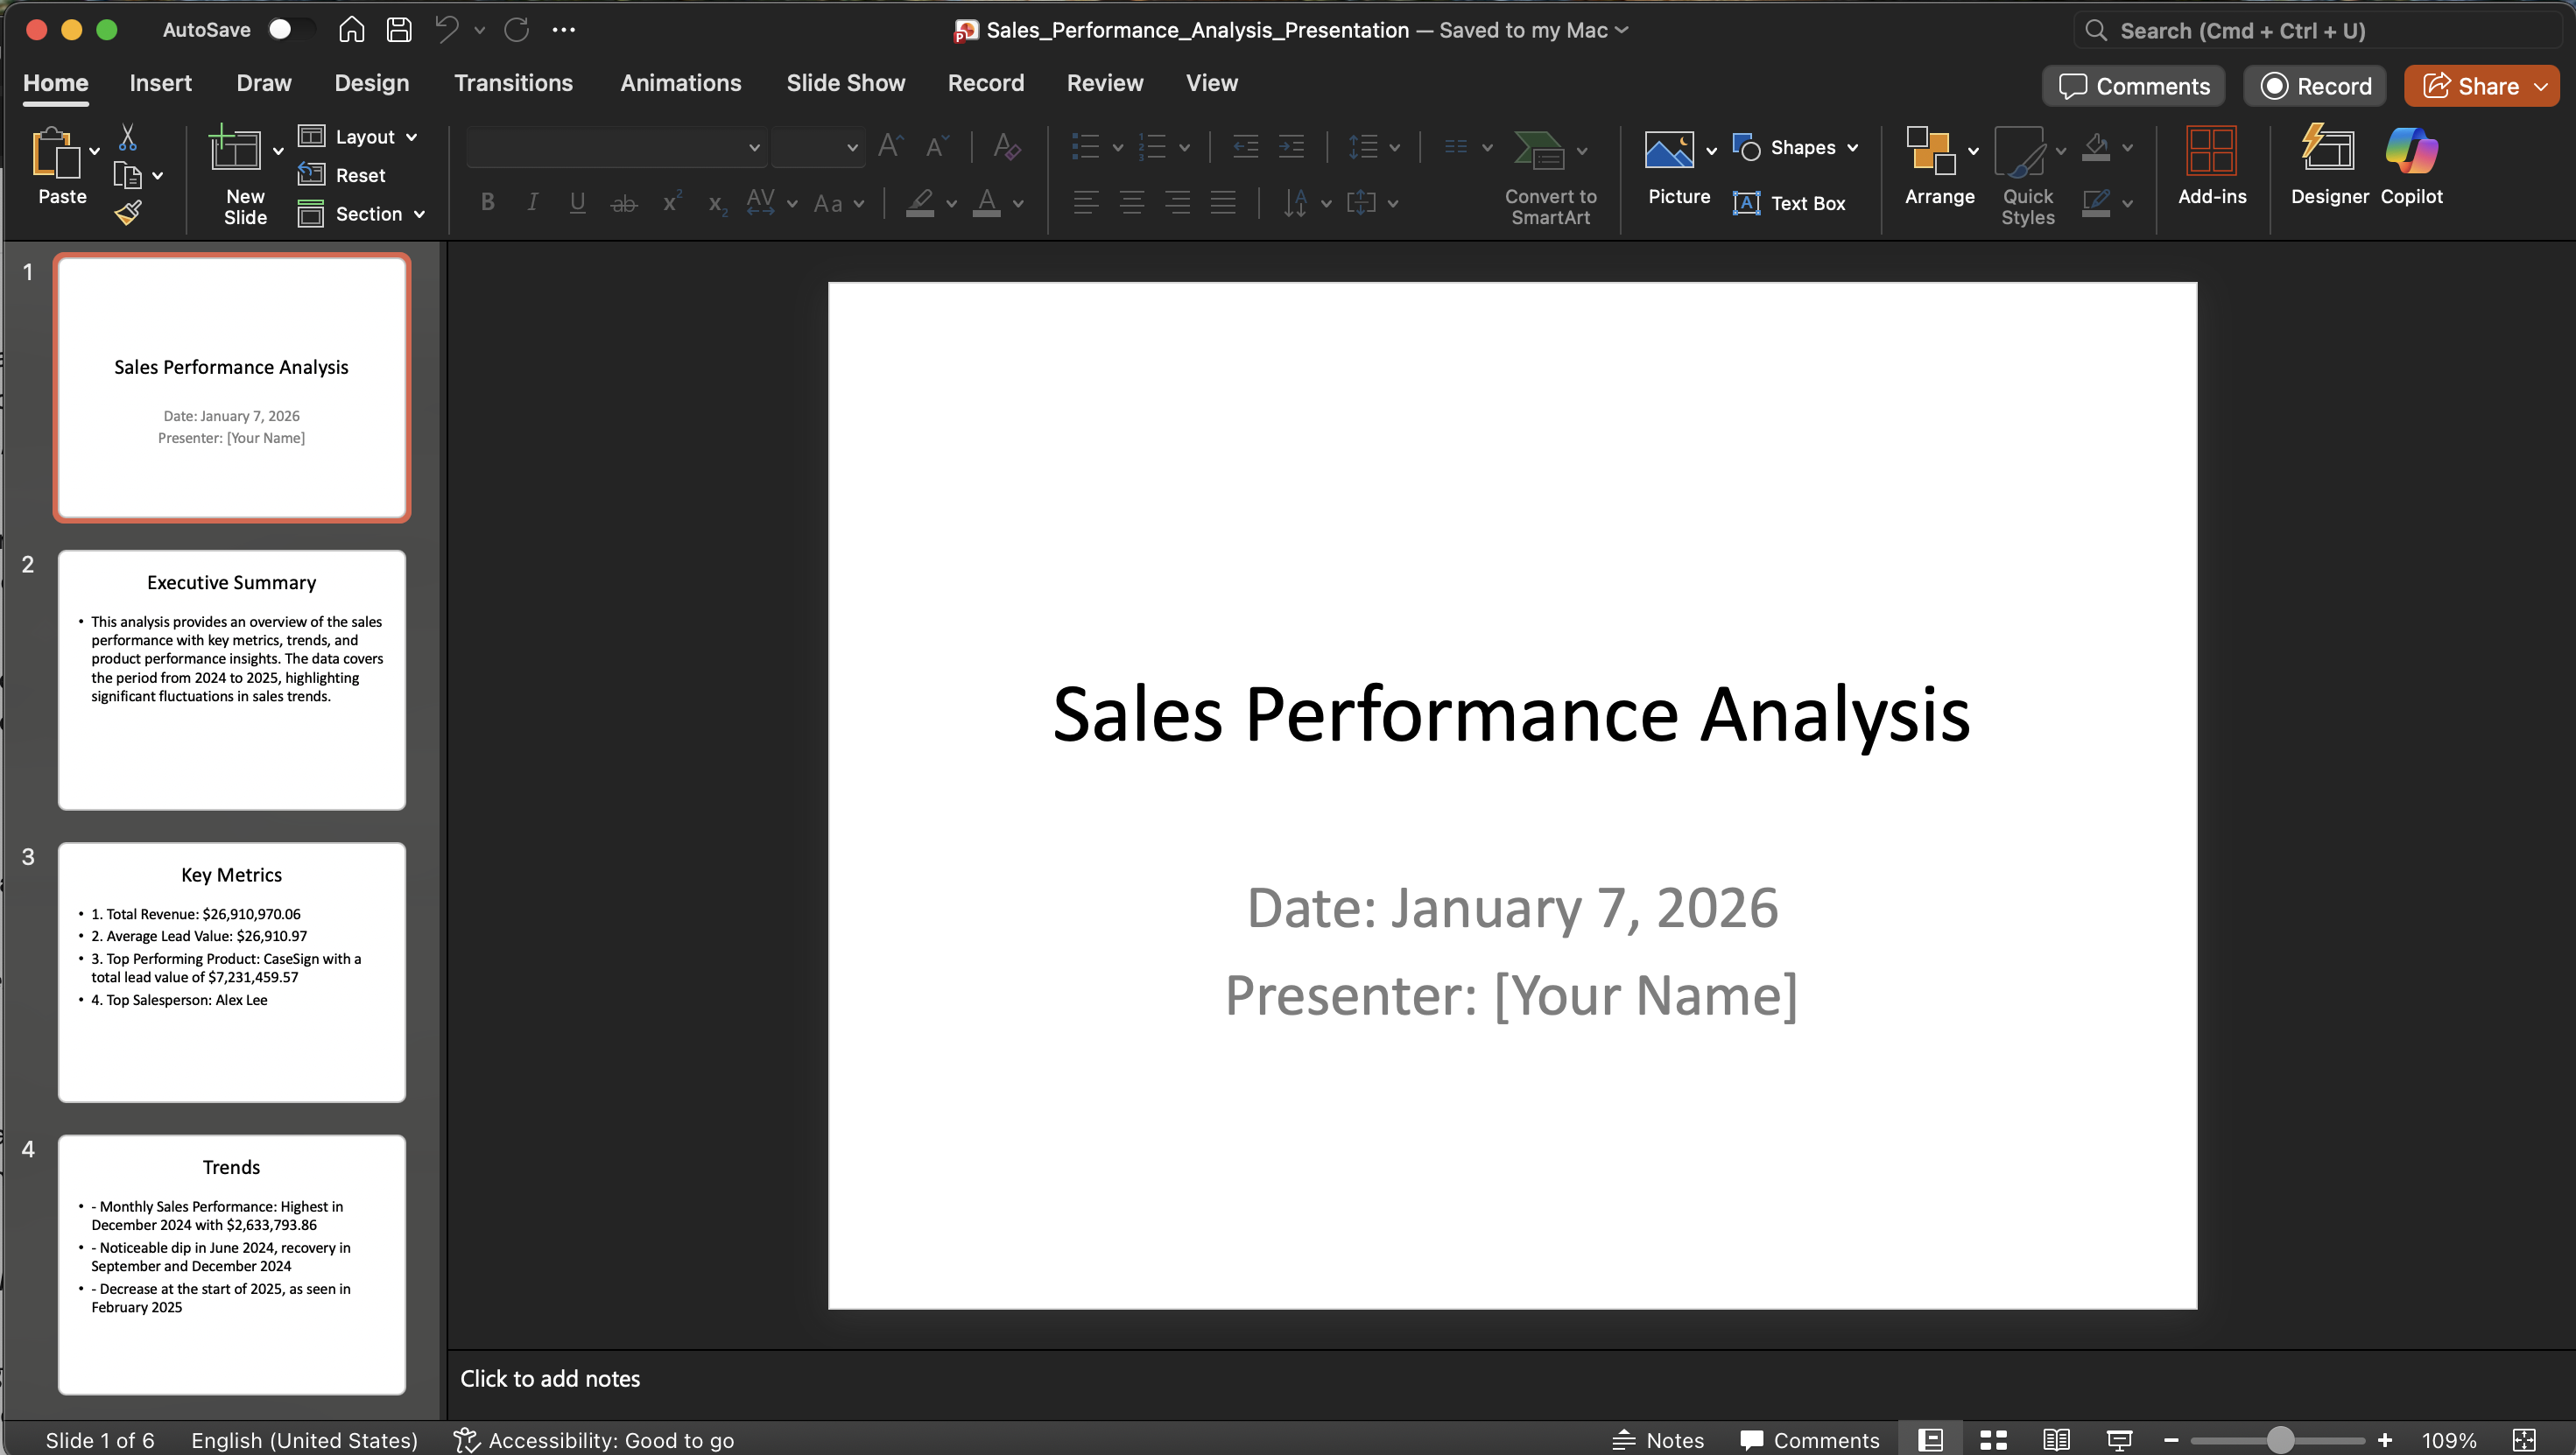
 ### Review the output
Generated presentations include professional slides with your data insights, key metrics, trend analysis, and embedded visualizations.
### Review the output
Generated presentations include professional slides with your data insights, key metrics, trend analysis, and embedded visualizations.
 ## Next steps
Analyze data interactively in Agent conversations.
Learn more about the action that powers data analysis in Workflows.
Import datasets and run your Workflow at scale.
Other ways to generate files through Agents and Workflows.
## Next steps
Analyze data interactively in Agent conversations.
Learn more about the action that powers data analysis in Workflows.
Import datasets and run your Workflow at scale.
Other ways to generate files through Agents and Workflows.