Artifacts are ideal for creating ad-hoc reports and visual presentations when you need to present information more effectively than plain text:
- Visual presentation of complex data — Transform sales data, performance metrics, or analysis results into interactive charts and graphs
- One-off reports for meetings — Generate quarterly performance sheets, project summaries, or presentation materials to share with leadership and teams
- Prototyping and mockups — Create proof-of-concept tools like pricing calculators, comparison tools, or workflow demonstrations to visualize ideas before full development
- Making dense information digestible — Convert lengthy text reports or analysis outputs into structured, visual formats with filtering and drill-down capabilities
Enable Artifacts
You can enable Artifacts in two ways:On an Agent
1
Open the Agent editor
Go to Agents, find the Agent you want to configure, and click Edit.
2
Add the capability
In the Setup tab, scroll to Capabilities, click + Add, and select Artifacts.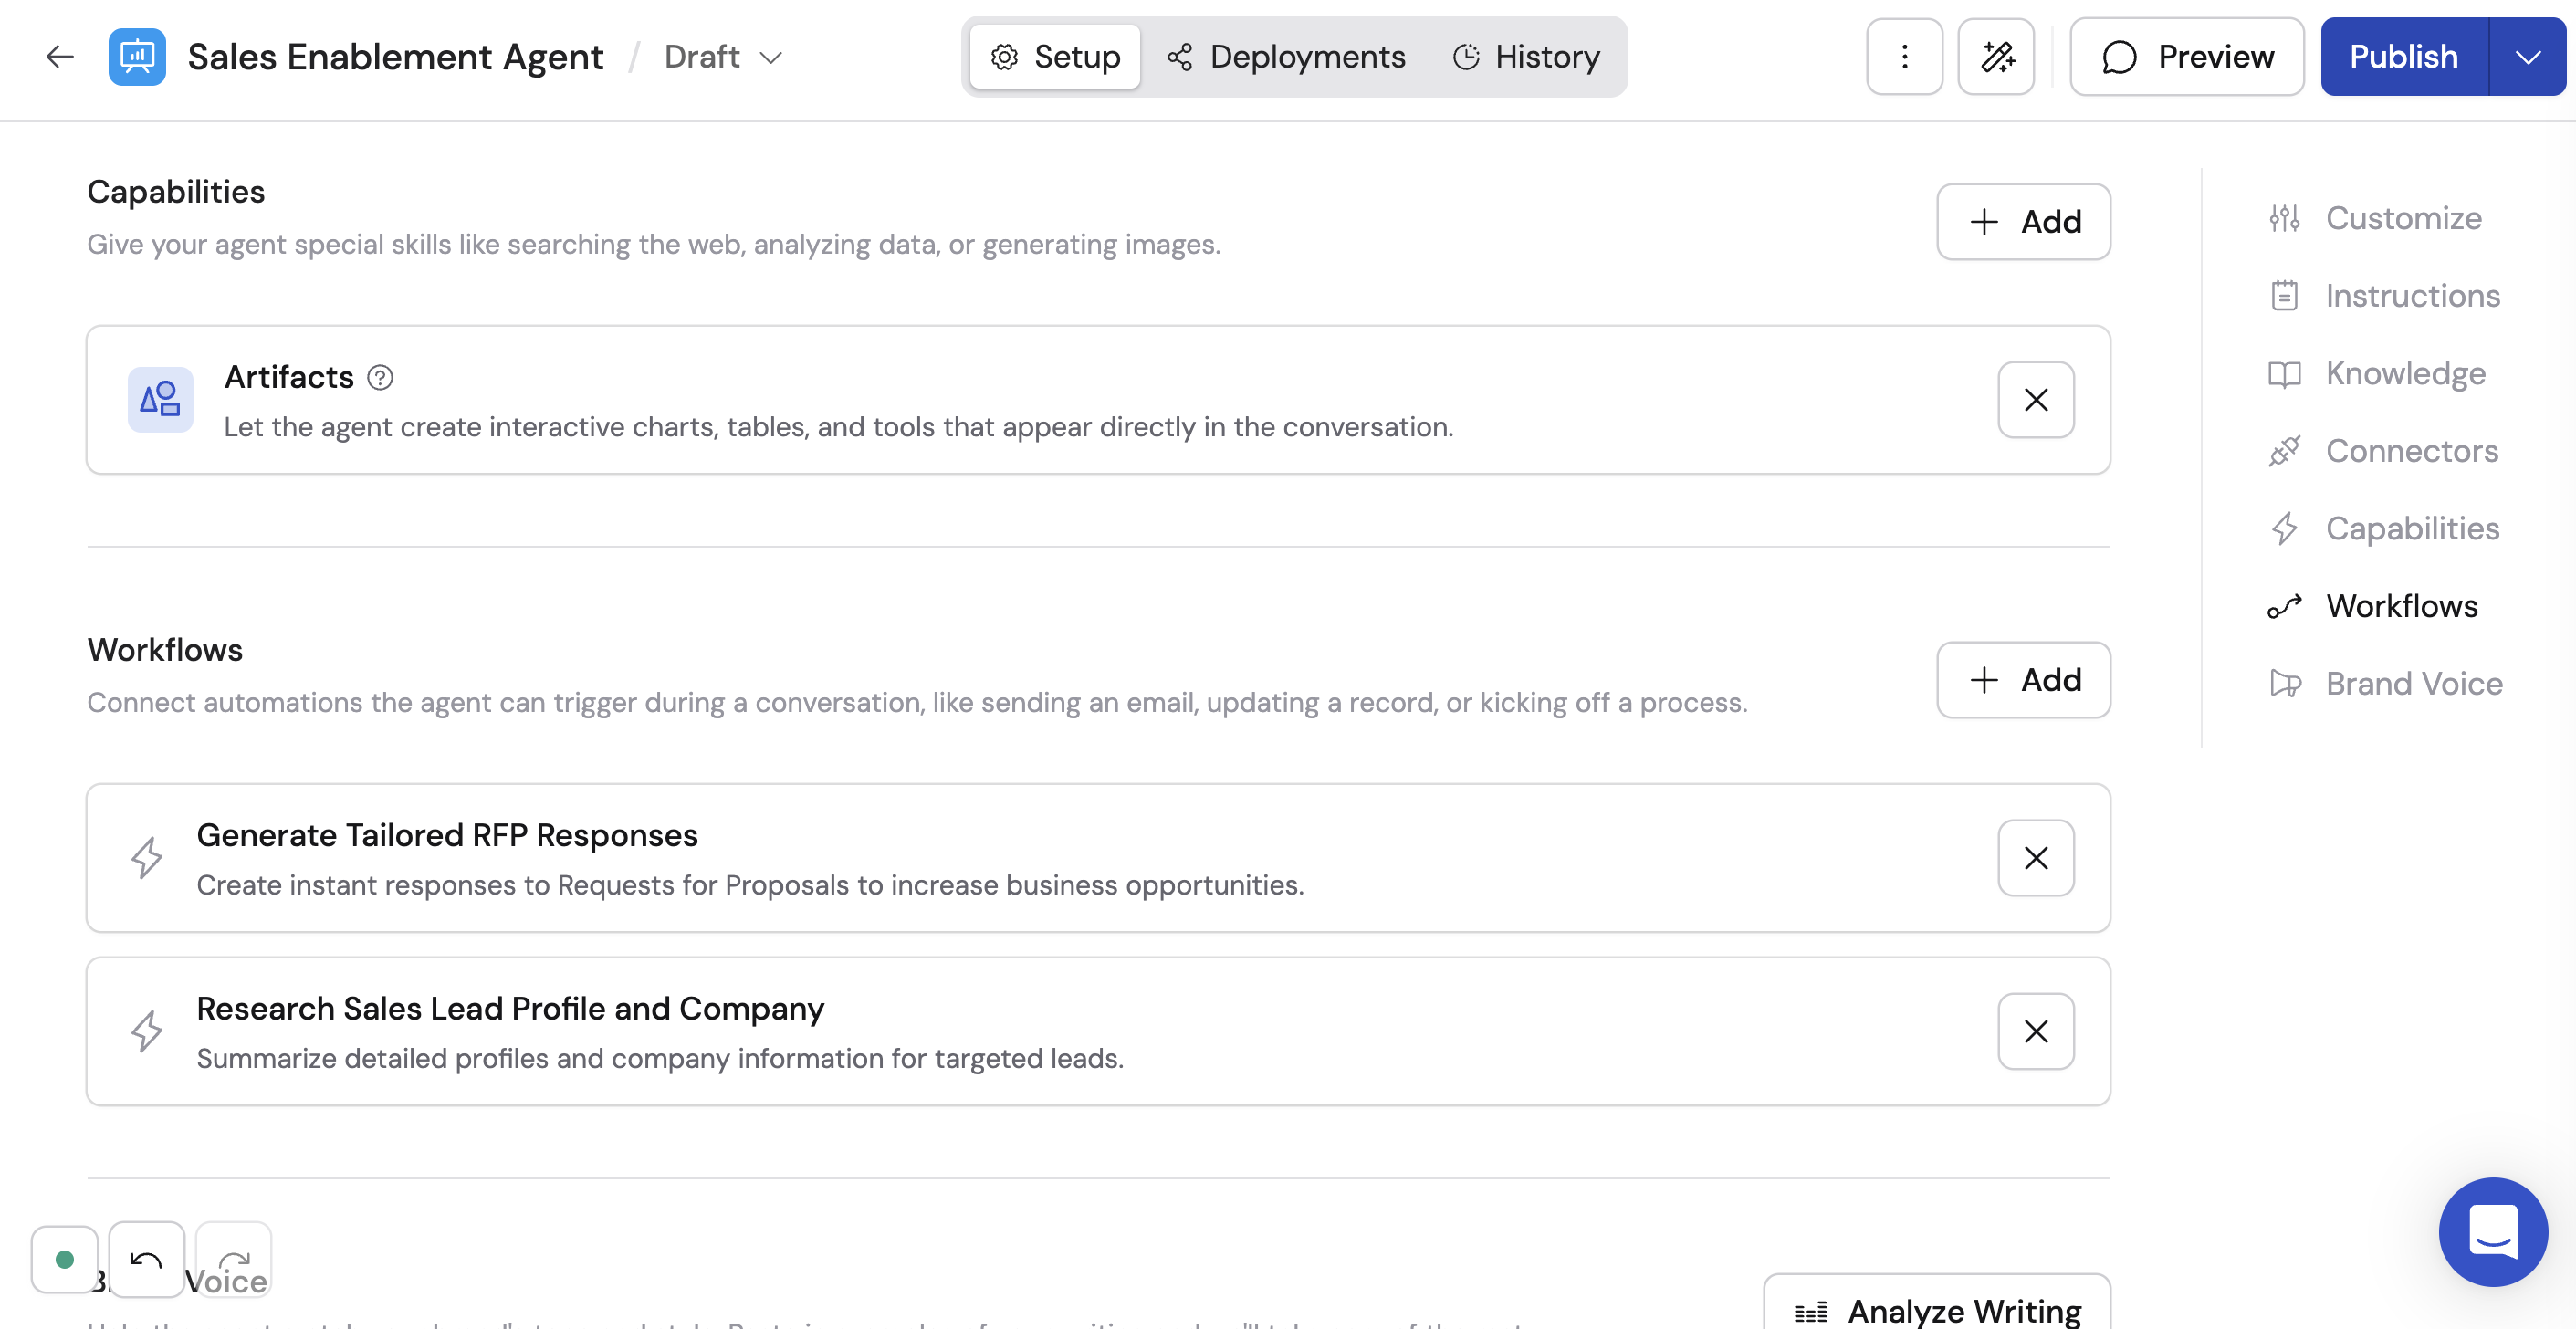
3
Publish your Agent
Click Publish to make the capability available.
In a Chat session
You can also toggle Artifacts on for any chat session using the Tools picker in Chat, without adding it permanently to the Agent.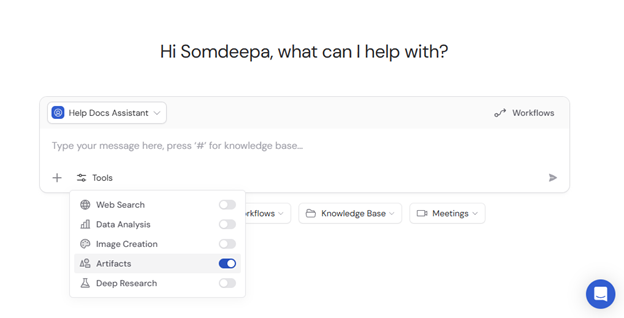
How to use it
1
Request interactive content
Ask the Agent to create something interactive — a dashboard, a calculator, a report with charts, or a visual prototype. Be specific about what data to include and how it should look. You can provide data by uploading files, referencing Knowledge Base items with #, or pulling data from connected integrations like Salesforce, Snowflake, or Airtable.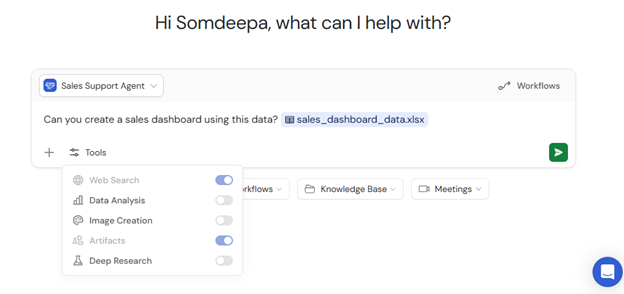
2
View the Artifact
The Agent renders the artifact in a dedicated panel alongside the chat. You can interact with it directly — click buttons, filter data, and explore.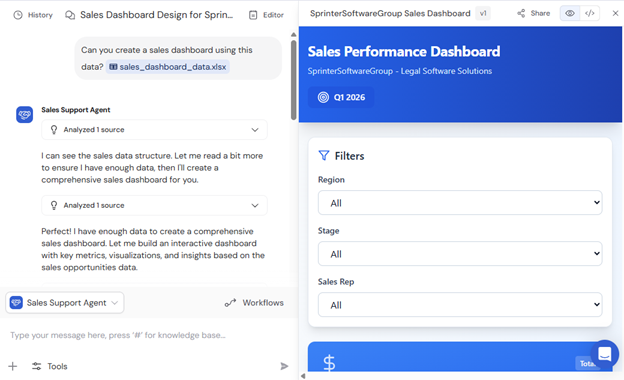
3
Iterate on the result
Continue the conversation to request changes, add features, or adjust the design and functionality. The Agent updates the artifact in real time based on your feedback.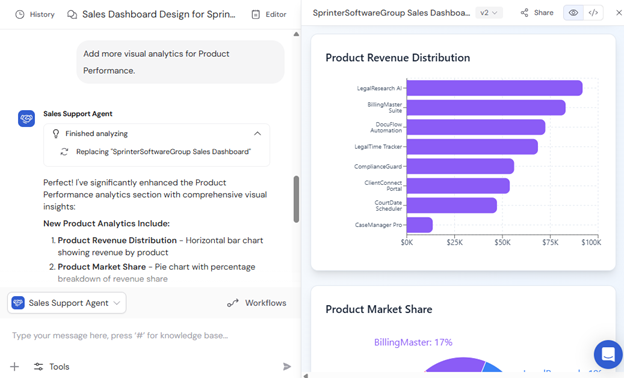
4
Open in full view
Click the expand icon to view the artifact in a full-screen tab where you can explore all features and functionality.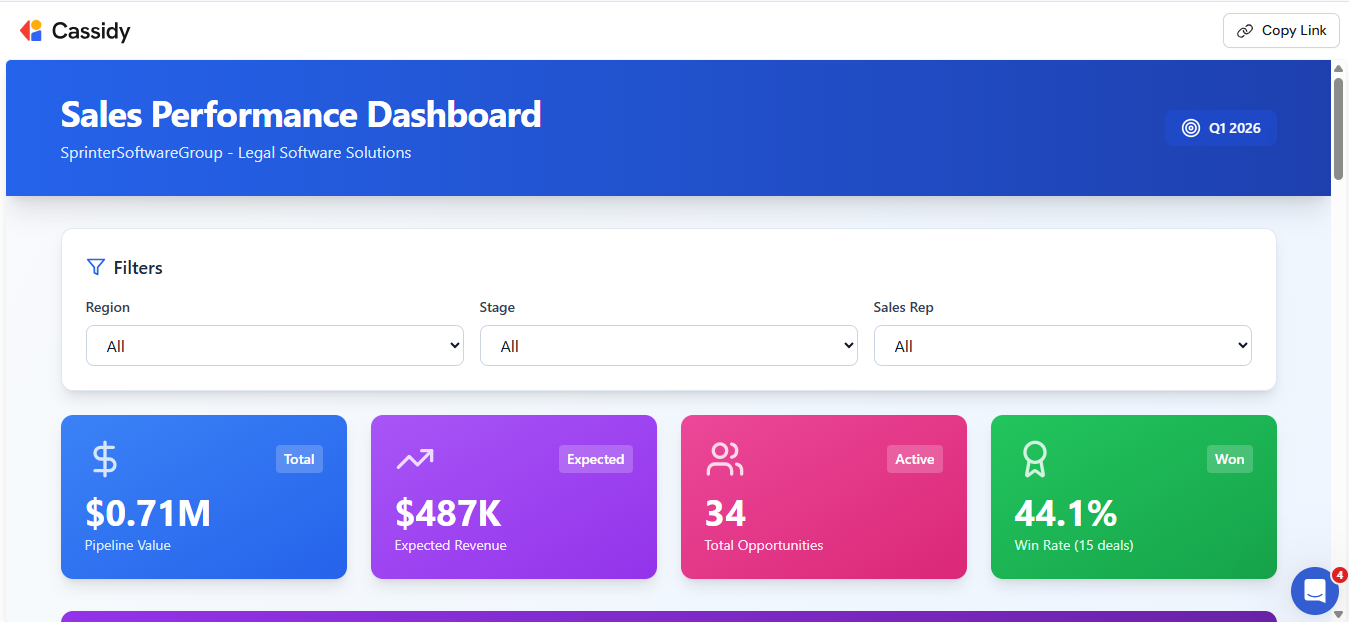
5
Share the artifact
Copy a link to the artifact so others can view it in their browser. Recipients must be signed into Cassidy and have access to the chat to view the artifact.
Artifacts display static data from the point of creation — they don’t update automatically when underlying data changes. They work best as reports and ad-hoc analysis rather than operational dashboards that need live data refresh. For ongoing automations that generate artifacts programmatically, use the Create Artifact action in a Workflow.
Next steps
Analyze data with an Agent
Analyze structured data and create visualizations from spreadsheets.
Browser Use
Automate interactive web tasks with a live browser.